Blog Index — Rolling View — RSS
[link—standalone]The power law has provided a simple and accurate model of Bitcoin prices to date. In essence, it states that price growth is exponential as a function of log-time. Put more simply, every 1% increase in time (measured in days) is followed by a similar X% increase in Bitcoin's price. This relationship can be written as the following formula:
ln(Price) = β0 + ln(Time) × β1
Where β0 and β1 are the intercept and slope of the price formula. Rewriting this formula as a power law gives the following relationship:
Price = eβ0 × Timeβ1
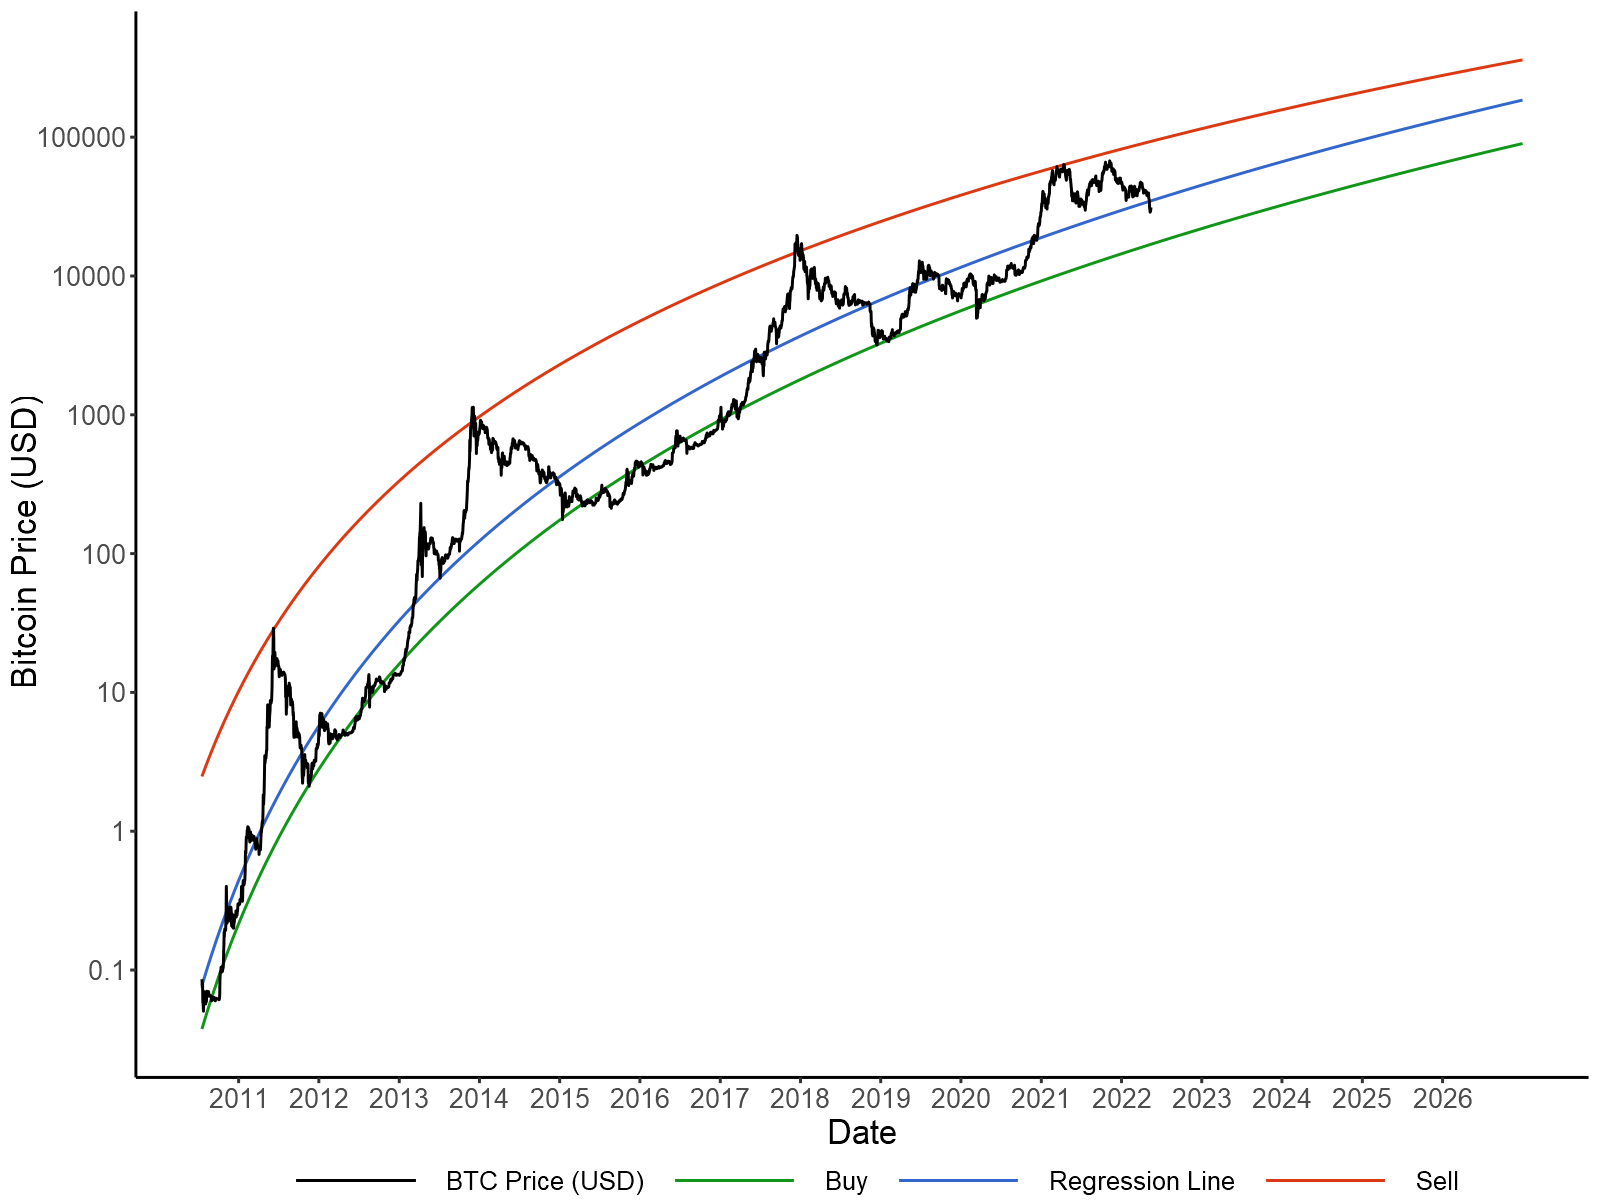
While this log-log relationship between price and time has been previously discussed, it is worth updating with recent data. In particular, the $69k high in November, 2021 fell short of the $100k expectations produced by the immensely popular stock-to-flow model, while the subsequent price crash has been less severe than previous cycles. Consequently, it is worth measuring this decline in volatility as Bitcoin becomes a mainstream investment.
The above model was applied to daily closing prices from July 18, 2010 to May 15, 2022 via linear regression. It is worth noting that time (measured in days) is an arbitrary convention, as there is no day one, no particular date the price of Bitcoin started following a power law. Therefore, the value corresponding to July 18, 2010 was varied to produce the best model fit, with a starting value of 448 being chosen. In order to assess to what extent price volatility has decreased over time, a trading strategy was generated using two additional "buy" and "sell" lines. The slopes and intercepts of these lines were fit to produce the greatest ROI to date (in USD terms) for a trader that only bought or sold Bitcoin whenever these targets were met.
This analysis is depicted above with the an r-squared of 0.9507, meaning the power law accounts for 95% of the variance in log-prices. β0 and β1 were -36.1743 and 5.5058 respectively, indicating that for every 1% increase in time, the price of Bitcoin increased 5.5%. For the optimal buy line β0 = -36.8846 and β1 = 5.5046, indicating that growth in the price floor has been nearly identical to our regression model. However, for the optimal sell line β0 = -26.2872 and β1 = 4.4549, indicating that volatility to the upside has declined over time. Overall, trading according these price targets would provide an approximately 434% annualized return since July 18, 2010.