For the last couple days I've been trying Nostr, a fairly new protocol for decentralized social media. It exhibits some improvements over the fediverse, such as user identities being represented by public keys rather than tied to a single server, or the underlying protocol being easier to develop on than ActivityPub. However, a catastropic flaw is the integrated tipping system, zaps, wherein one person can tip another Bitcoin via the Lightning Network.
One of the worst problems of social media is the gameification of social interactions. With Reddit for example, people aren't incentivized to say what they really think, but what they (at least subconsciously) think will gain them the most upvotes. The end result being a hive-mind where all posts and interactions degenerate towards the lowest common denominator. Nostr's zaps are like that, but with money in addition to the endorphin rush. They're Reddit gold on steroids. Their effect is already widespread with users begging for money, openly admitting they love the endorphin rush, that they're addicted to zaps, and mindlessly parroting pro-Bitcoin slogans while avoiding any form of critical discussion. So while Nostr itself it a technically interesting platform, the social incentives and resulting user-base are terrible.
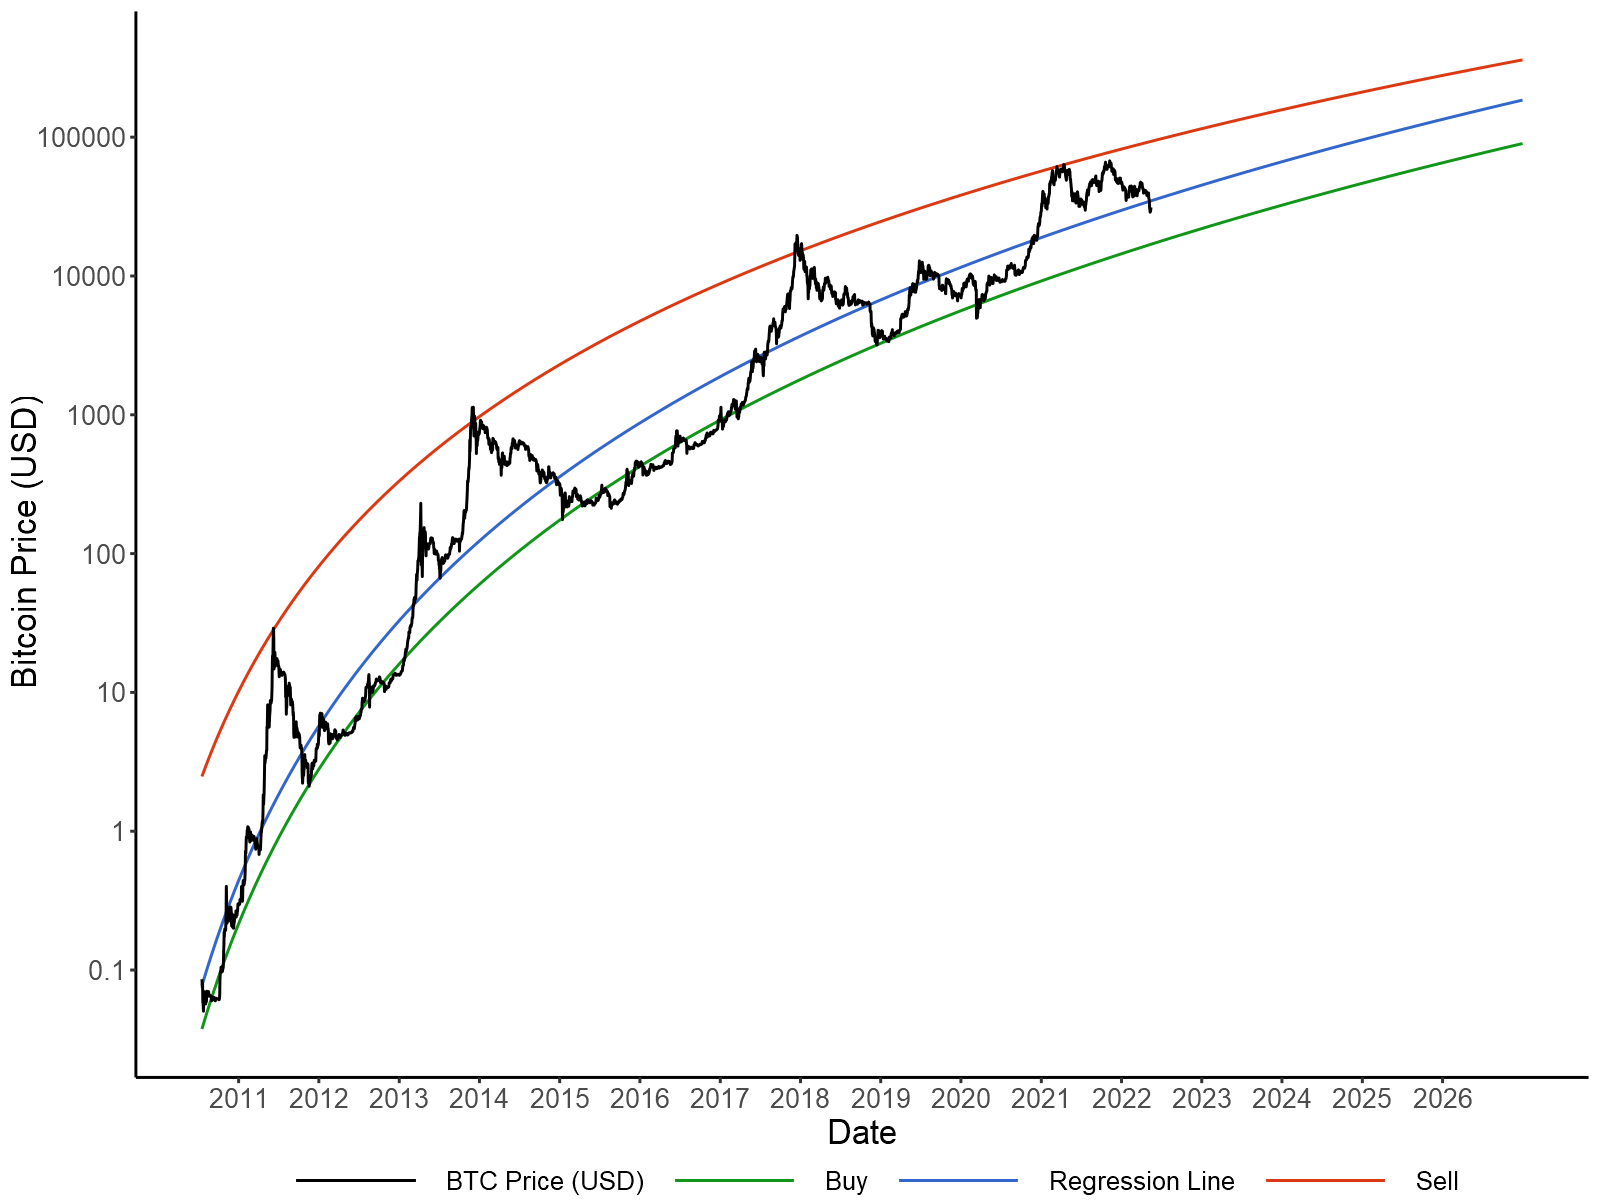
The power law has provided a simple and accurate model of Bitcoin prices to date. In essence, it states that price growth is exponential as a function of log-time. Put more simply, every 1% increase in time (measured in days) is followed by a similar X% increase in Bitcoin's price. This relationship can be written as the following formula:
ln(Price) = β0 + ln(Time) × β1
Where β0 and β1 are the intercept and slope of the price formula. Rewriting this formula as a power law gives the following relationship:
Price = eβ0 × Timeβ1
While this log-log relationship between price and time has been previously discussed, it is worth updating with recent data. In particular, the $69k high in November, 2021 fell short of the $100k expectations produced by the immensely popular stock-to-flow model, while the subsequent price crash has been less severe than previous cycles. Consequently, it is worth measuring this decline in volatility as Bitcoin becomes a mainstream investment.
The above model was applied to daily closing prices from July 18, 2010 to May 15, 2022 via linear regression. It is worth noting that time (measured in days) is an arbitrary convention, as there is no day one, no particular date the price of Bitcoin started following a power law. Therefore, the value corresponding to July 18, 2010 was varied to produce the best model fit, with a starting value of 448 being chosen. In order to assess to what extent price volatility has decreased over time, a trading strategy was generated using two additional "buy" and "sell" lines. The slopes and intercepts of these lines were fit to produce the greatest ROI to date (in USD terms) for a trader that only bought or sold Bitcoin whenever these targets were met.
Bitcoin price fit to a power-law (blue) with optimal buy (green) and sell (red) targets.
This analysis is depicted above with the an r-squared of 0.9507, meaning the power law accounts for 95% of the variance in log-prices. β0 and β1 were -36.1743 and 5.5058 respectively, indicating that for every 1% increase in time, the price of Bitcoin increased 5.5%. For the optimal buy line β0 = -36.8846 and β1 = 5.5046, indicating that growth in the price floor has been nearly identical to our regression model. However, for the optimal sell line β0 = -26.2872 and β1 = 4.4549, indicating that volatility to the upside has declined over time. Overall, trading according these price targets would provide an approximately 434% annualized return since July 18, 2010.
Biz, the business section of 4chan, is generally considered one of the earliest and richest sources of information regarding cryptocurrencies. For example, SHIB was widely advertized there in late January, before the price increased over 20,000 times in the following four months. However, this useful information is usually obscured by scammers and people advertizing their own projects.
To get a somewhat reliable overview of the cryptocurrencies preferred by /biz/, I ran three polls there and asked people to rank groups of twelve cryptocurrencies on StrawPoll.vote. The below table provides the results from 179 respondents, scored under the Borda Count and Plurality voting systems. In addition, the aggregated results of all three polls are available here. Each cell indicates the number of times a coin in column 'i' was ranked above one in row 'j'. Values on the diagonal give the total number of polls in which each coin was ranked.
Rank
N = 87
Borda %
Plur %
N = 47
Borda %
Plur %
N = 45
Borda %
Plur %
1
XMR
78.16
35.63
DOT
68.47
10.64
ALGO
64.44
13.33
2
ETH
74.19
8.05
ALGO
67.89
8.51
MATIC
60.20
8.89
3
BTC
72.73
25.29
ATOM
65.57
6.38
BAT
57.58
15.56
4
LINK
67.19
10.34
KDA
64.60
14.89
XLM
56.57
6.67
5
DOT
49.74
2.30
HBAR
53.58
25.53
GRT
56.16
11.11
6
ALGO
45.14
3.45
XZT
53.00
6.38
UNI
52.53
6.67
7
BNB
38.98
0.00
AVAX
50.87
4.26
AVAX
51.52
6.67
8
PNK
38.24
0.00
SOL
43.13
0.00
ADA
49.49
11.11
9
LTC
35.74
1.15
ONE
41.78
4.26
IOTA
48.08
4.44
10
XRP
33.96
6.90
ADA
35.40
10.64
THETA
41.01
8.89
11
IOTA
33.33
2.30
FTM
30.17
8.51
BCH
35.76
4.44
12
ADA
32.60
4.60
ZIL
25.53
0.00
DOGE
26.67
2.22
While these data aren't sufficient to provide a comprehensive ranking of all cryptocurrencies considered, a few findings are obvious. First Monero (XMR) is the first choice among a significant proportion of /biz/ and has widespread support across the entire board. Given it has a market cap (as of June 18) of 4.878 billion, ~140 times less than that of Bitcoin, it is heavily undervalued according to /biz/. While Ethereum is only the first choice among a small propotion (8.05%) of /biz/, it also has more widespread support than Bitcoin. Finally, while a number of coins including Cardano, Ripple, and Dogecoin enjoy a high market cap, they are considered to be overvalued, with low rankings.
Lately I've been pretty busy, so haven't put aside much time to write. However, things have now settled down at work and with my hobbies, so it is worth giving an update.
Early last month Luke Smith posted a video lamenting the fact that recipe websites are incredibly bloated. Between the ads and the endless pages of life stories, it would be worth having a simple website that hosted recipes and nothing else. Fortunately, recipeasly.com provided just that. Unfortunately, their business model consisted of scraping recipes and images from other websites. Aside from the issues of rehosting copyrighted material, food bloggers stood to lose their ad-revenue, and so mobbed the creators. In response, recipeasly was taken down.
Rejecting all that free press (whether good or bad) seems a waste. So I immediately bought the recipeasly.org, .net, and .ca domains and set up a website of my own. So far, you can search recipes, browse by category, or via an image gallery. Each recipe also includes a printable index card. In the upcoming weeks I'll add a submission form, a rating system for each recipe, and possibly comments. Since I started, Luke Smith has also put up the site based.cooking. However, I don't care if my cooking is "based" and Luke is generally opposed to JS, so there is plenty of room for both our websites. As a way of marketing my site, and to ensure each recipe has a photo, I may hold a photo contest in the future with a cash or cryptocurrency prize.
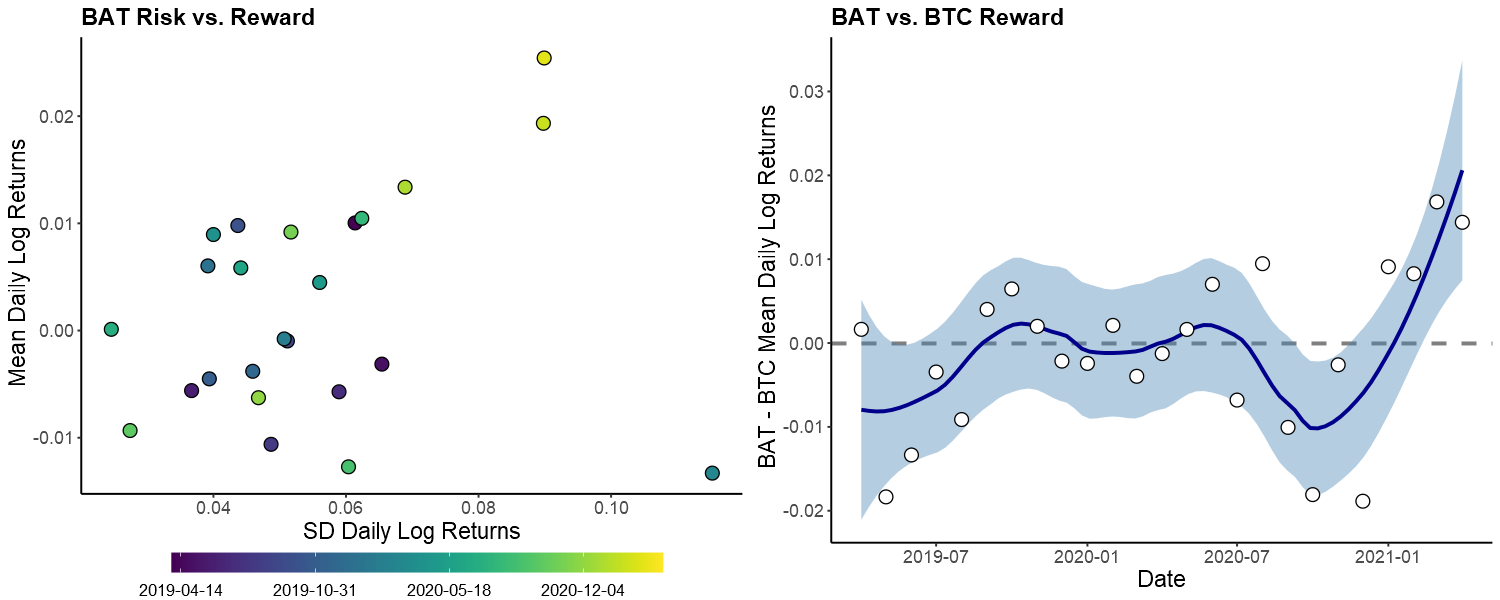
Speaking of cryptocurrency, I've also spent a fair amount of time reading about the Basic Attention Token (BAT) since Brave released their new roadmap. This is in part because the price was steadily increasing. For example, the figures below demonstrate that the daily returns and volatility (averaged over each month) of BAT have steadily increased in recent months. Moreover, after a long period of underperforming relative to bitcoin, BAT has been outperforming since the start of 2021. As such, I managed to buy a fair amount at $0.68 before it shot up to $1.30.
Left: daily log-returns and risk (SD log-returns) from BAT, averaged over each month since April, 2019. Right: difference between BAT and Bitcoin log-returns.
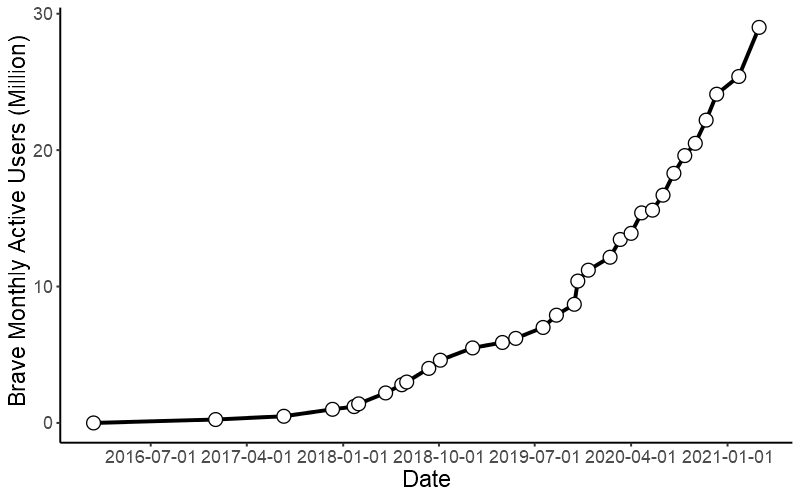
However, I am more interested in the long-term use cases for BAT, and likely won't sell for the next few years. As of today, Brave now has 29 million active users and user growth has been incredibly steady. Since January 2019, users have increased by 124.92% per year, as indicated by log-linear regression. Moreover, this increase is extremely reliable, having an r-squared of 0.9877. In other words, 98.77% of the change in user numbers is accounted for as an exponential increase over time. If the current trend holds, Brave can expect to have 69 million users one year from now and 155 million in two years. However, with the upcoming release of self-serve ads, a decentralized exchange, and the ability to pay for goods and services in BAT, my estimate is likely conservative.
Total number of Brave monthly active users since release of the browser.
I've also been spending a good deal of time researching IOTA, as a fast, feeless, energy efficient network that scales limitlessly will be necessary for the future of cryptocurrency. Moreover, I'd like to set up a sensor network in my community, and IOTA seems like a promising platform for such projects. However, this is a topic for a future post.
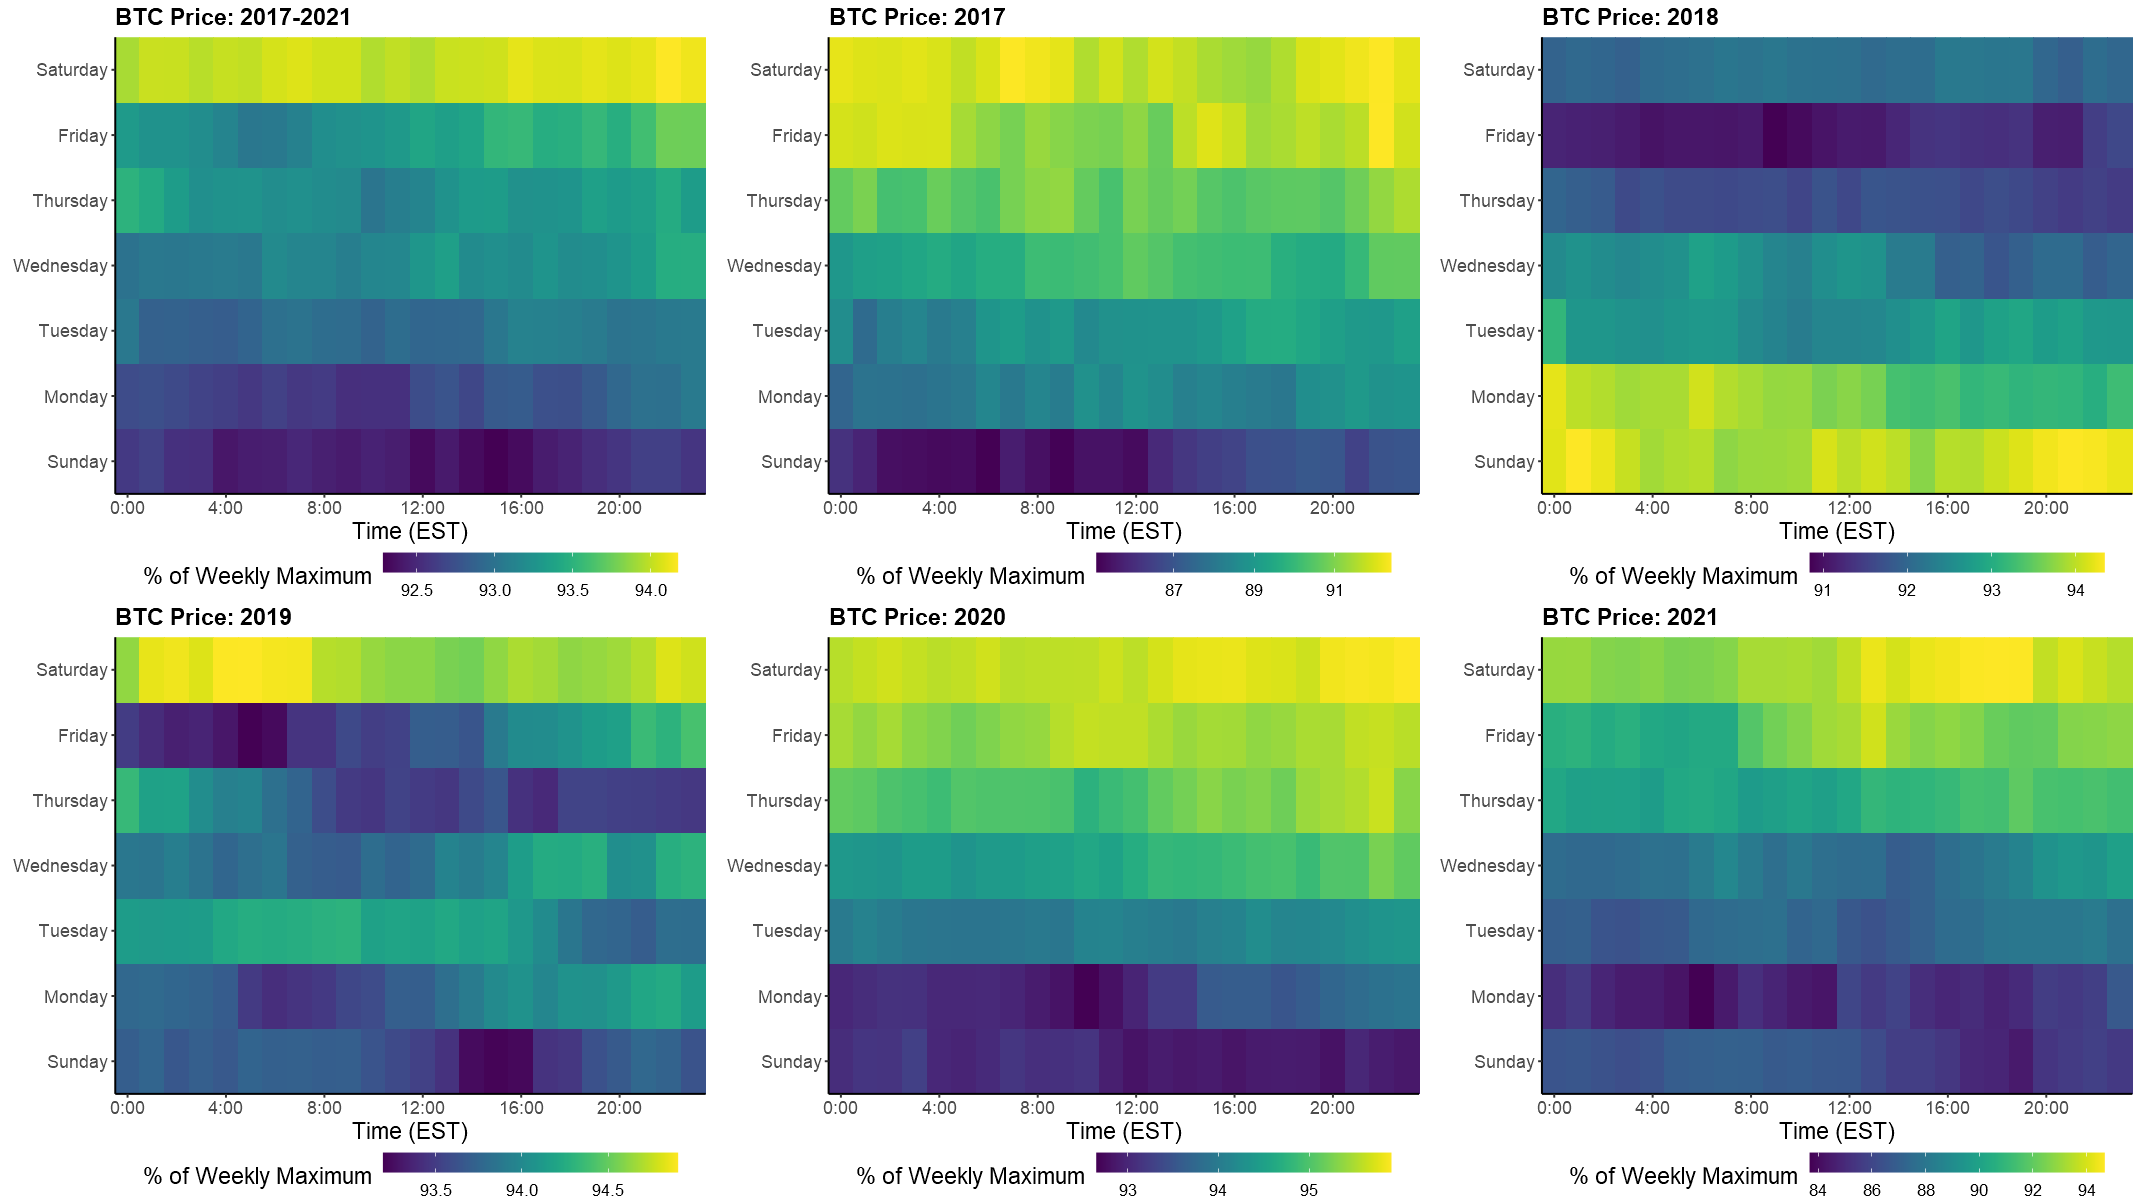
There's a long standing belief that crypto dumps over the weekend, one reinforced by prices over the last few days. If systematic highs and lows do exist the market should adapt, causing the timing of the weekly dump to drift over time. Fortunately, it is easy to verify whether this belief holds true from historical price data. Hourly closing Bitcoin prices on Binance between August, 2017 and February 2020 are available from cryptodatadownload.com. Using this data, I calculated hourly prices in each week as the percentage of the weekly maximum. Afterwards, it is a simple matter to average all the weeks in a year, providing an indication of when Bitcoin is at its lowest.
Average hourly Bitcoin prices during the week, as a percentage of the weekly maximum.
As seen in the above figure, Bitcoin is generally at its lowest and highest during the weekend. Between 2017-2021, weekly lows moved from Sunday, to Friday, and back to Sunday. However, over the first months of 2021 the weekly dump has occurred Monday morning. Conversely, the best time to sell has drifted from Saturday to Sunday.
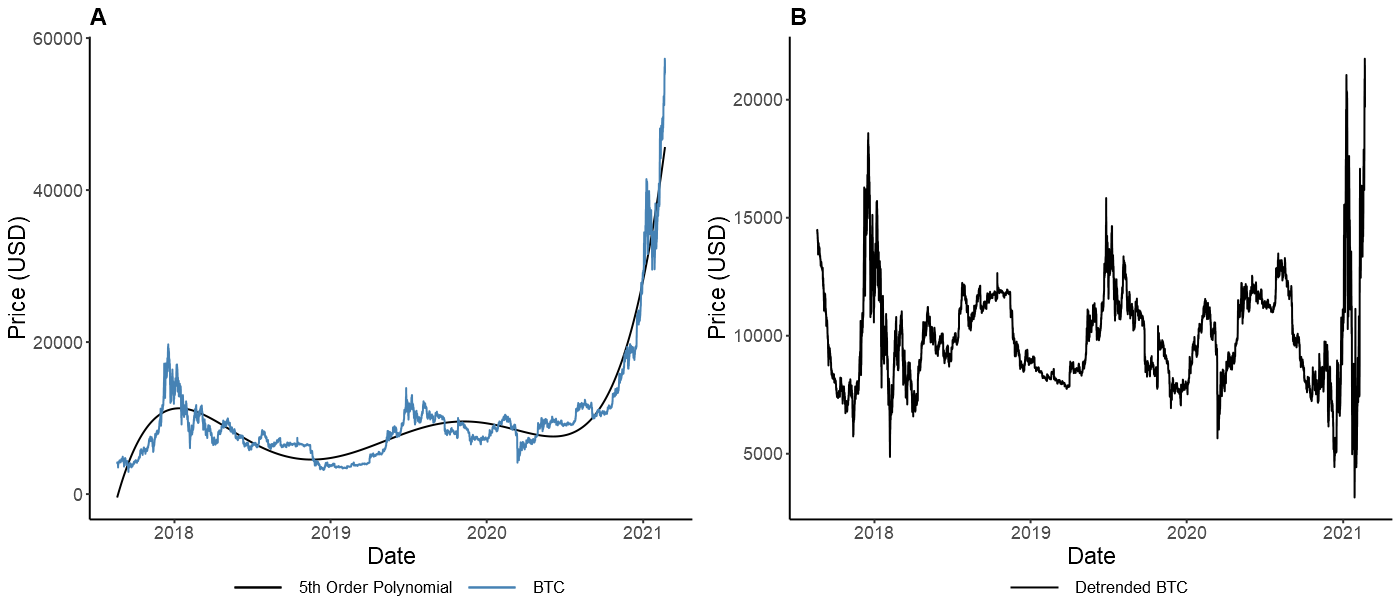
A: A 5th degree polynomial fit to Bitcoin prices. B: Detrended Bitcoin prices.
However, it could be argued that this data only demonstrates the average linear trend in Bitcoin prices over the week. In years where the price is steadily increasing, one should expect that the Saturday price will exceed that of the preceding Sunday. To correct for this bias, I detrended the price by fitting a 5th degree polynomial. As seen in the above figure, this was subtracted from the actual price, so that it now fluctuates around an average of $9900.
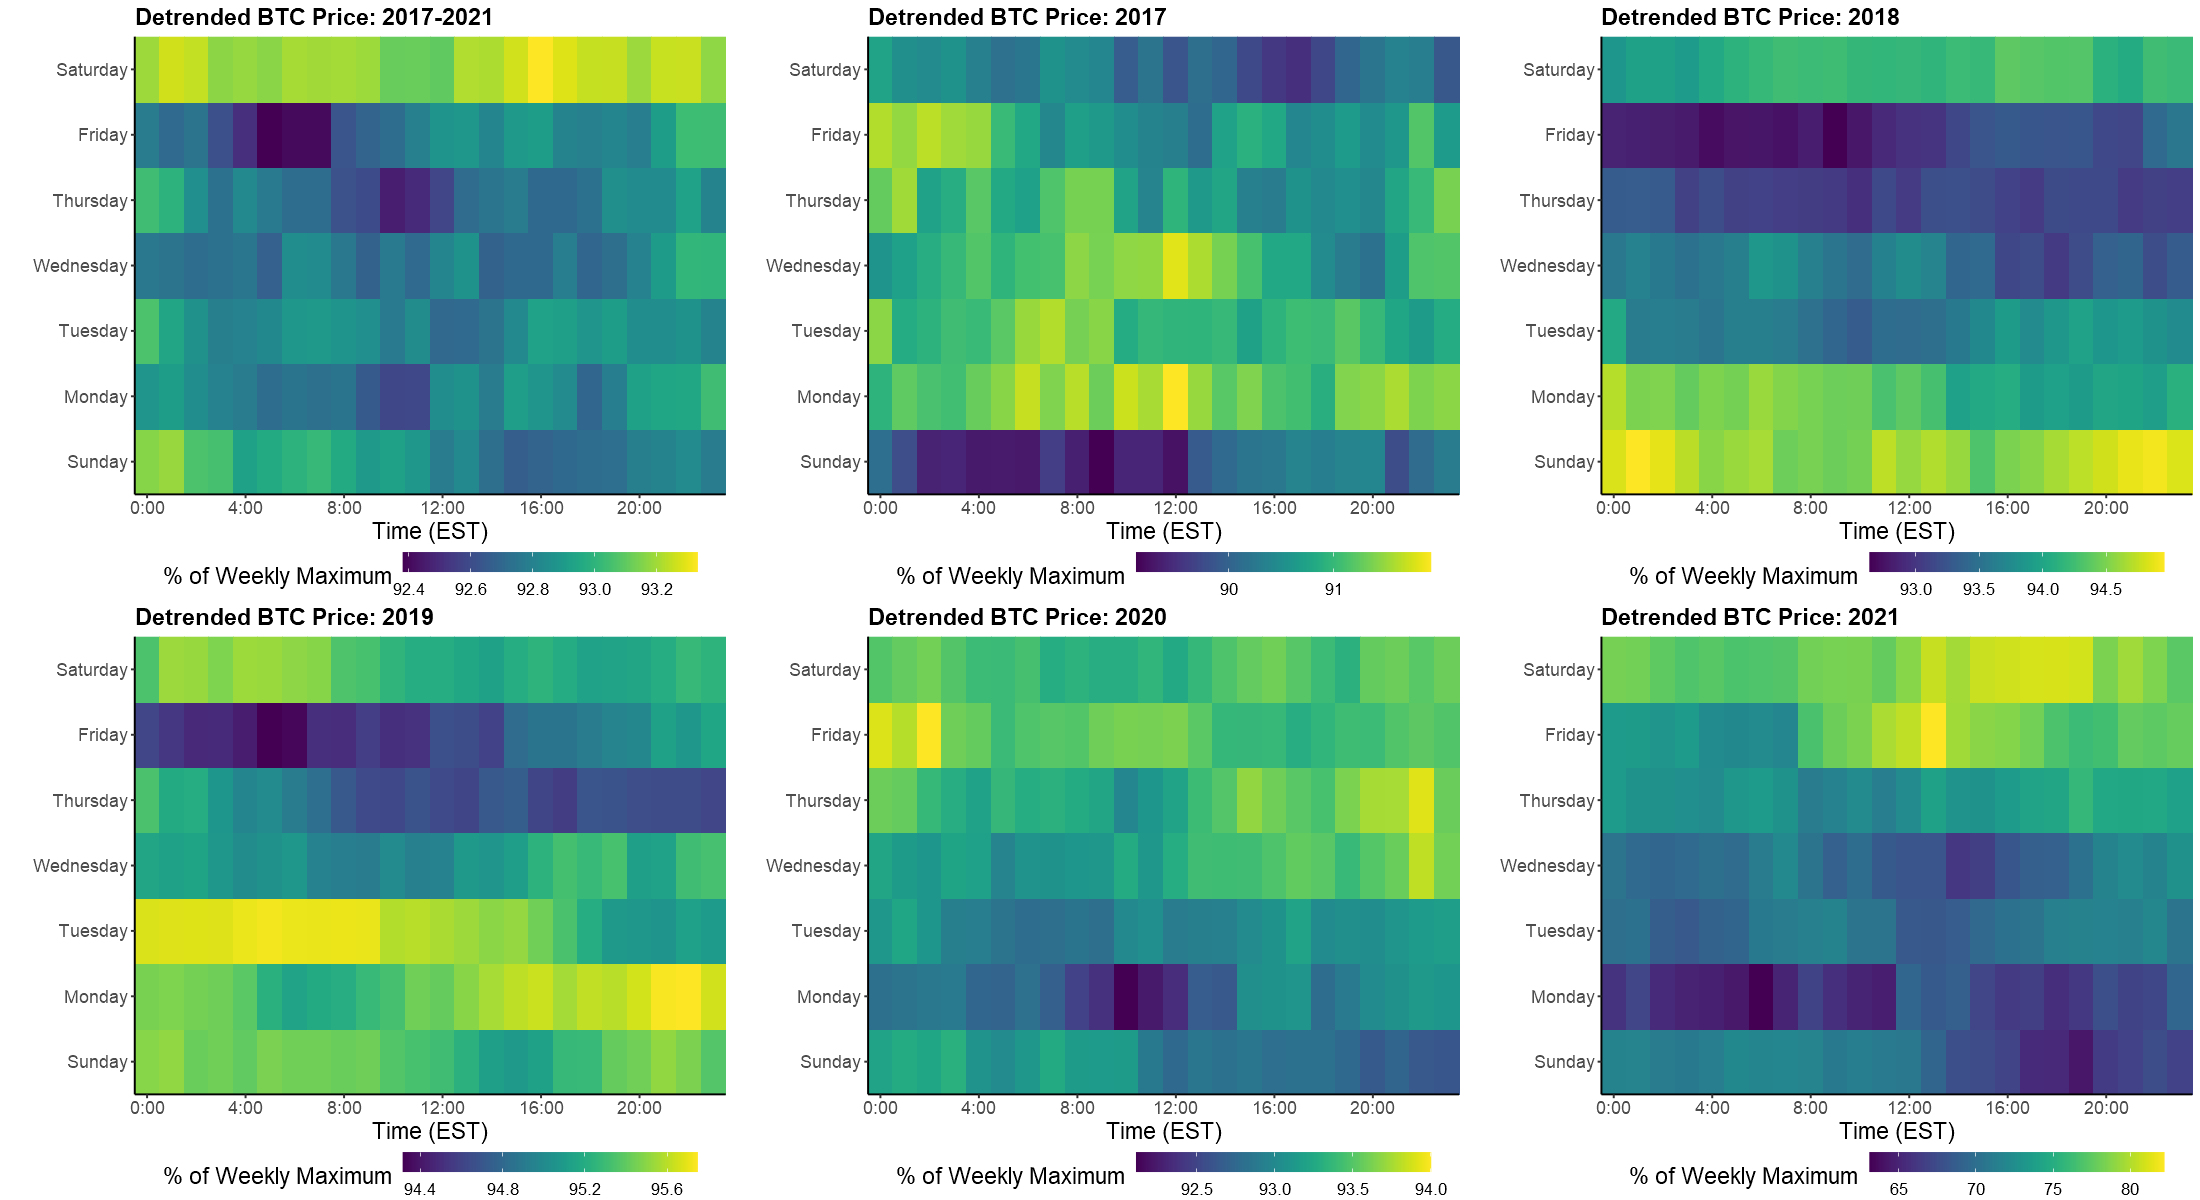
Detrended average hourly Bitcoin prices during the week, as a percentage of the weekly maximum.
The same hourly prices over the week were calculated using this detrended data. As seen above, prices have still tended to pump on Saturday since 2017. However, this is usually preceded by a dump on Friday morning. More recently, Bitcoin prices have tended to dump Monday, rather than on the weekend. Therefore, the belief that crypto dumps over the weekend does not hold true every year.
I stopped using Facebook a while ago. Aside from the issues with privacy and free expression, it was a time sink, and the news feed only served as a source of unnecessary anger. However, I have been using the Mastodon instance Fosstodon lately. It's largely devoid of international news, I enjoy the community, and has a code of rules that suit my preferences.
I'm interested in how Fosstodon operates, when its members are the most active, and how often they interact with one another. As such, I've been playing with the Mastodon API, in order to pull statuses and user information from the server. While I'm not much for Python, the Mastodon.py library is an easy tool for interacting with the API. It only requires registering an application and logging in to your server.
from mastodon import Mastodon

# create an application
Mastodon.create_app(
     'myapp',
     api_base_url = 'https://fosstodon.org',
     to_file = 'myapp_clientcred.secret'
)

# log in to our server
mastodon = Mastodon(
    client_id = 'myapp_clientcred.secret',
    api_base_url = 'https://fosstodon.org'
)
mastodon.log_in(
    'parker@pbanks.net',
    'aReallyGreatPassword',
    to_file = 'pytooter_usercred.secret'
)
After connecting to your instance, the mastodon.timeline() function pulls statuses from the home, local, or public timelines, or statuses with a given tag, starting from max_id. For me, each call returned the last 40 statuses, so I used the following loop to pull the last 50000 toots from the local timeline, from May 28, 2020 to February 7, 2021. Keep in mind there is a request limit of 300 per 5 minutes, so the time.sleep() funtion can be used to space out requests.
# request files from local timeline, starting at max_id
myFile=mastodon.timeline(timeline='local', max_id=105687600003001040, limit=40)
output=myFile

# use last status id at starting point for next request
myId=myFile[39]["id"]
for x in range(1249):
    myFile=mastodon.timeline(timeline='local', max_id=myId, limit=40)
    myId=myFile[39]["id"]
    output.extend(myFile)
The end result is a list of dictionaries that contain the time and content of each status, tags, number of replies, boosts, etc. Also nested within is a dictionary detailing the associated account, creation date, total followers, etc., that I pulled into a separate list. Given I am only insterested in the frequency and timing of toots, I also removed status tags, content, and other unnecessary information. Finally, I put each list into a pandas data frame and exported these to excel files.
# put account information into separate list
accounts = [output[0]['account']]
for d in output[1:]:
    accounts.extend([d['account']])

# remove unwanted fields
for d in output:
    for e in ['in_reply_to_account_id', 'spoiler_text','uri','favourited','reblogged',
	'muted','bookmarked','content','account','reblog','media_attachments',
	'mentions','emojis','card','poll','tags']:
        d.pop(e, None)
for d in accounts:
    for e in ['username','display_name','note','url','avatar','avatar_static',
        'header','header_static','last_status_at','emojis','fields']:
        d.pop(e, None)

#convert lists to data frames
import pandas
output = pandas.DataFrame(output)
accounts = pandas.DataFrame(accounts)

# delete time zone from status and account creation dates
dfPosts['created_at'] = dfPosts['created_at'].astype(str).str[:-6]
dfAccounts['created_at'] = dfAccounts['created_at'].astype(str).str[:-6]

# cast account id to string to prevent rounding errors
dfPosts['id'] = dfPosts['id'].astype(str)
dfPosts.to_excel("foss50k.xlsx")
dfAccounts.to_excel("account50k.xlsx")
CSV files containing the Fosstodon statuses from May 28, 2020 to February 7, 2021 and associated accounts are available here.
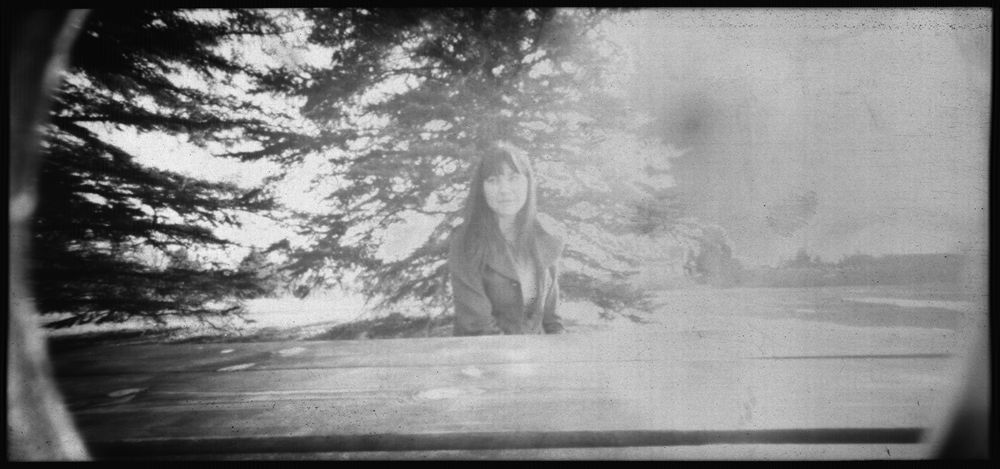
Lately I've been getting back into film photography. Some years ago I took a fair number of medium format pictures using a Holga pinhole camera. I never digitized any of my negatives, mostly due to the lack of a decent scanner. I still lack a proper scanner, having only a sub-par Brother model meant for documents. However, I may be able to use a few mathematical tricks to make it work far past its intended potential.
A poor-quality film scan.
As seen in my first scan, the main problem is I can't control the exposure time on my scanner and negatives end up much too dark. While some information can be recovered by correcting the contrast and gamma of each image, this is overwhelmed by the noise produced by the scanner. Moreover, I was lazy so the film was obscured by dust, hairs, and fingerprints. Fortunately, the random noise can be removed by averaging multiple scans. However, I also wanted to try removing various sources of systematic noise (i.e., prints, hairs, film imperfections). Ultimately, I took 125 scans of the negative in four different positions on the scanner bed, each with their own imperfections. After reading each image into Matlab, I corrected the contrast, gamma, and registered each image to align differences in position and rotation.
img = zeros(2692,5738,125);
for i = 1:125
    % read in scans and correct gamma and contrast limits
    img(:,:,i) = 1-mat2gray(double(imread(['Image_',num2str(i),'.bmp'])));
    img(:,:,i) = imadjust(img(:,:,i),[0.5, 1],[],10);
end

% register images, allowing for rotation and translation
mkdir Registered % directory for registered images
regImg = zeros(2692,5738,125);
[optimizer, metric] = imregconfig('monomodal'); % assume similar brightness and contrast
optimizer.MaximumIterations = 1000; % increase iterations
regImg(:,:,27)=img(:,:,27); % reference image

idx = [1:26, 28:125];
for i=1:length(idx)
    regImg(:,:,i) = imregister(img(:,:,i), img(:,:,27), 'rigid', optimizer, metric);
end

meanImg = mean(regImg,3);
figure; % display mean image
imshow(meanImg,[]);
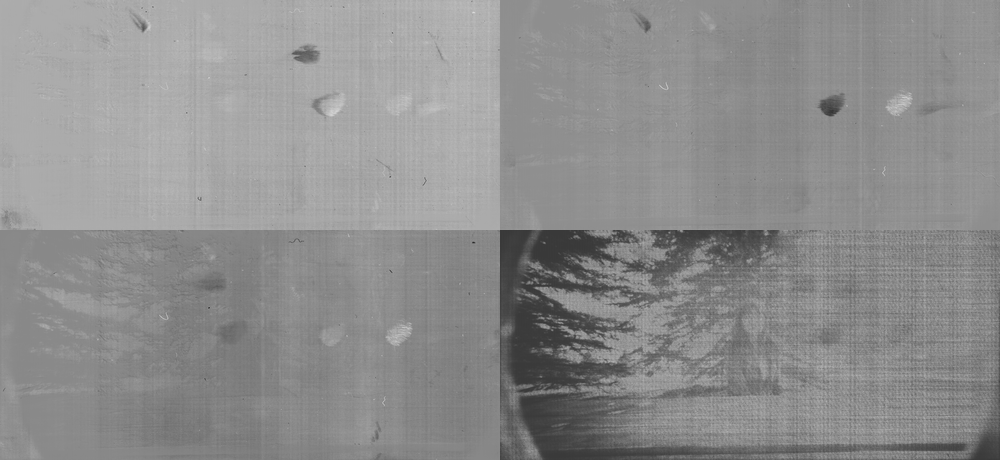
Noisy, gamma and contrast corrected scans.
The end result is pretty rough. However, we can remove the noise produced by the scanner by taking the average of each pixel across all scans.
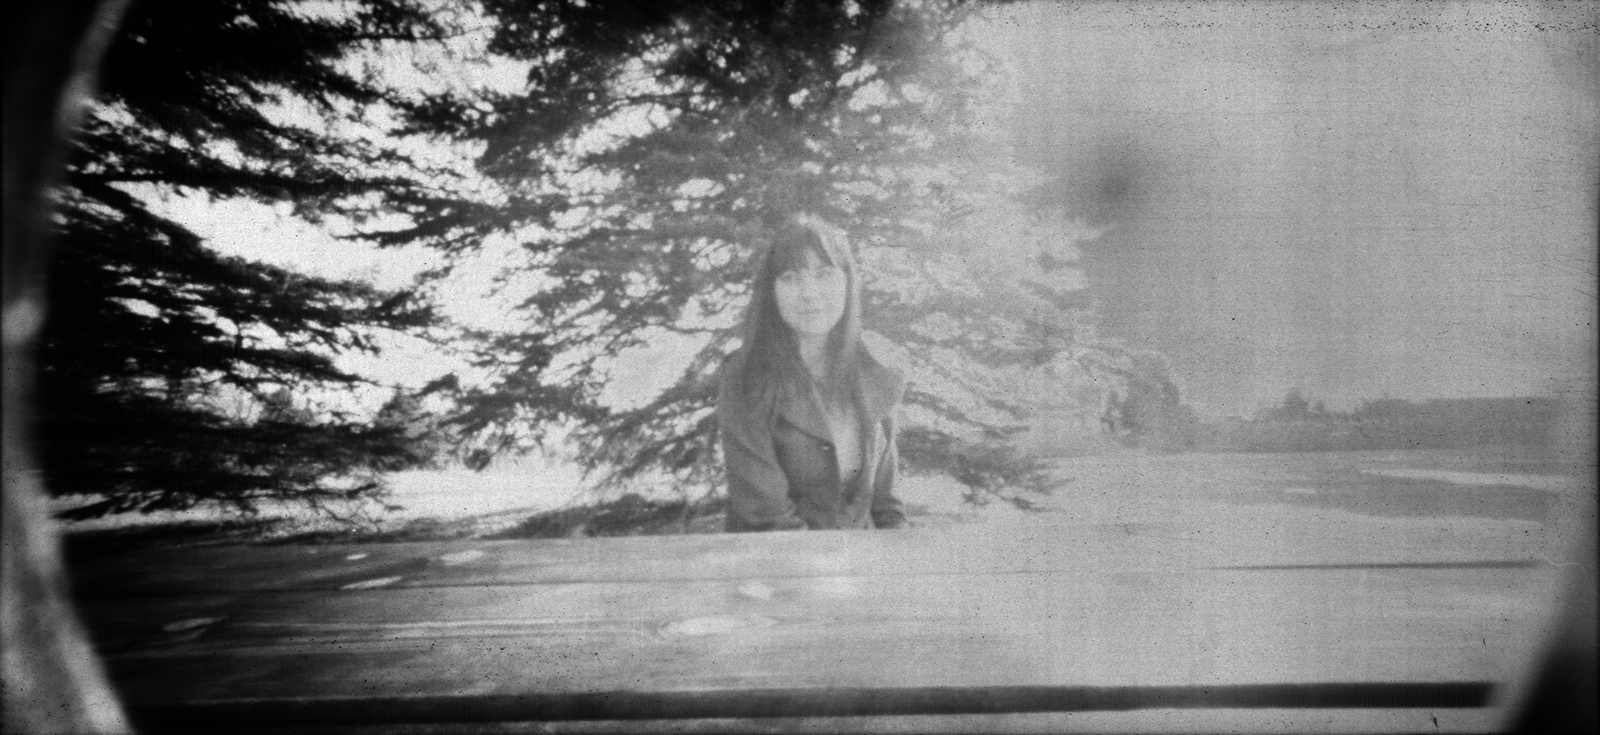
The average of all 125 negative scans.
However, two sources of noise still remain. The various hairs and fingerprints present in the different scans have to be removed. Second, regular vertical lines are present throughout the negative. While these would not be visible in a proper scan, the increased image contrast has made them more present. While the fingerprints will be difficult to address, the lines are regular and can be removed my moving the image into the frequency domain.
As seen above, a strong horizontal line is present throughout the frequency spectra of our image, representing the regular pattern of vertical lines. By removing these frequencies, we should also remove the lines without affecting the rest of our image. So, we will need a function to filter out frequencies ±2° from vertical. As the lines are closely spaced, we don't need to filter out low frequencies, only those above 200 cycles/image.
function thefilter = ofilter(oLow,oHigh,dim);
    % a bandpass filter of size dim that passes orientations between oLow and oHigh
    % horizontal and vertical are 0 and 90 degrees
    t1 = ((0:dim-1)-floor(dim/2))*(2/(dim));
    [t1,t2] = meshgrid(t1,t1);
    a=atan2(t1,t2)*180/pi;
    t1=t1.*t1+t2.*t2;
    clear t2
    a=mod(a,180);
    oLow=mod(oLow,180);
    oHigh=mod(oHigh,180);
    thefilter=ones(size(t1));
    if oHigh>=oLow
        d=find((a=oHigh) & t1>0); % find out-of-band frequencies
    else
        d=find((a=oHigh) & t1>0); % find out-of-band frequencies
    end
    if ~isempty(d)
        thefilter(d)=zeros(size(d));
    end
end

function thefilter = bpfilter(lowf,highf,dim);
    % a bandpass filter of size dim that passes frequencies between lowf and highf
    dc=[round(dim/2)+1,round(dim/2)+1];
    thefilter=zeros(dim,dim);
    dx=1:dim;dx=dx-dc(1);
    for yk=1:dim
        dy=dc(2)-yk;
        d=sqrt(dx.*dx + dy*dy);
        val1=find((d > lowf)&(d < highf));
        thefilter(yk,val1)=ones(1,length(val1));
    end
end

function thefilter=filter2d(lowf,highf,orient1,orient2,dim);
    % combines ofilter and bpfilter to pass frequencies between lowf and highf
    % and orientations between orient1 and orient2
    thefilter=bpfilter(lowf,highf,dim);
    temp=ofilter(orient1,orient2,dim);
    thefilter=thefilter.*temp;
    return;
end
Given the function filter2d, we can apply it to each image to remove all frequencies above 200 cycles/image that are within 2° of vertical.
thefilter = filter2d(200,5738,88,92,5738);
thefilter = 1-thefilter(1524:4215,:);

for i=1:125
    ft=fftshift(fft2(regImg(:,:,i)));
    amp=abs(ft);
    phase=angle(ft);
    r=size(amp,1);c=size(amp,2);
    dc=[round(r/2)+1,round(c/2)+1];
    dcAmp=amp(dc(1),dc(2));
    amp = amp.*thefilter;
    ft = amp.*exp(sqrt(-1)*phase);
    filtImg(:,:,i)=real(ifft2(fftshift(ft)));
end
Frequency filtered image.
Finally! We have removed the lines and are one step closer to having a clean picture. All that remains is to remove the various hairs and fingerprints present in each image. Fortunately, the position of these flaws varied between scans. I wiped down the negative, removing some prints and causing others to be deposited. Since presence or absence of these flaws are independent of the image, we can use independent component analysis (ICA) to isolate them and subtract them from our average image. The FastICA package is one of the best implementations of ICA.
filtImg=filtImg(59:2643,50:5678,:); % to avoid exceeding RAM capacity
[rows, columns, scans] = size(filtImg);
pcaArray = reshape(filtImg, rows * columns, scans)'; % reshape array for ICA
mu = mean(pcaArray,1); % the average image, ICA automatically subtracts this
[icasig, A] = fastica(pcaArray, 'lastEig', 8, 'numOfIC', 8); % take first 8 components
baseCase = mean(A(76:125,:),1); % scores for fingerprint-free images

% positive and negative parts of the first three components
ICAp1 = icasig(1,:); ICAp1(ICAp1 < 0) = 0;
ICAm1 = -icasig(1,:); ICAm1(ICAm1 < 0) = 0;
ICAp2 = icasig(2,:); ICAp2(ICAp2 < 0) = 0;
ICAm2 = -icasig(2,:); ICAm2(ICAm2 < 0) = 0;
ICAp3 = icasig(3,:); ICAp3(ICAp3 < 0) = 0;
ICAm3 = -icasig(3,:); ICAm3(ICAm3 < 0) = 0;
The first four independent components.
As seen above, ICA has isolated all the fingerprints and hairs that obscured our image within the first three independent components. Since all scans had defects, the absence of a flaw in one image implies the presence of another elsewhere. Therefore, each component captures both the presence (positive values & lighter pixels) and absence (negative values & darker pixels) of various features. As we want to make an image that contains none of these flaws, we separate the positve and negative values of each component.
All that remains is to find the ideal combination of component weights that removes all blemishes from the average image (mu). My approach was to generate random weights for two sets of components, add these to the average image, and indicate which looked better. It is a bit hacky, but a few iterations resulted in an image that looked half decent.
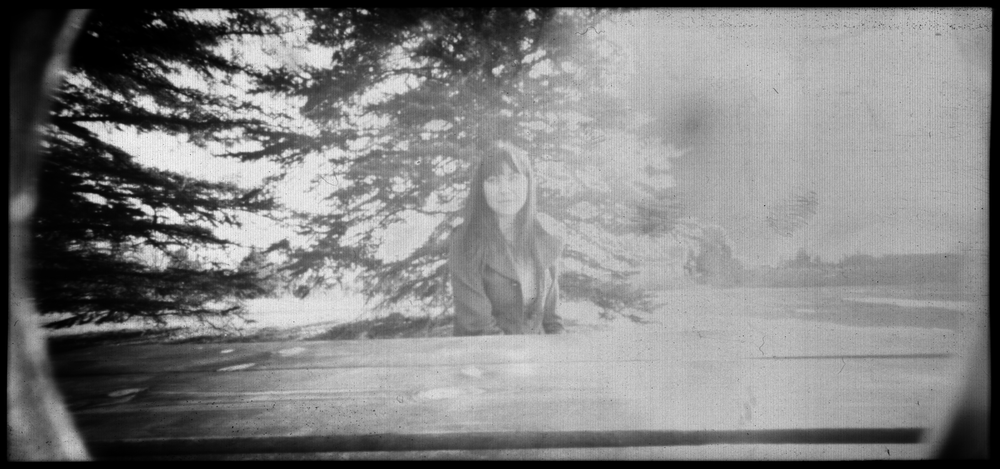
The final image, after filtering, ICA, and averaging.
And here it is, the final image. While it still could use a lot of work, the end result is a far cry from what my scanner initially produced. However, the main lesson is that I should probably buy a better scanner.
The importance of clean groundwater is pretty universal, about half of the world's population uses it for drinking water. However, ensuring that groundwater is clean and salt-free usually requires installation of a permanent monitoring well, a costly and often impractical process. Installing a well requires drilling equiptment, the wells aren't cheap, and they often get destroyed.
Conversely, measuring the salt content of a soil sample is a fairly simple process. It's temporary, doesn't require much equiptment, and you dont have to worry about landowners or animals destroying your handiwork. A while ago I published a paper on how to estimate the salt content in groundwater from soil samples. I've been learning JavaScript lately, so I made a tool for estimating groundwater quality from soil samples based on my findings. If you work in the environmental industry, hopefully you find it useful.
Biz, the business section of 4chan, is generally considered one of the earliest and richest sources of information regarding cryptocurrencies. For example, SHIB was widely advertized there in late January, before the price increased over 20,000 times in the following four months. However, this useful information is usually obscured by scammers and people advertizing their own projects.
To get a somewhat reliable overview of the cryptocurrencies preferred by /biz/, I ran three polls there and asked people to rank groups of twelve cryptocurrencies on StrawPoll.vote. The below table provides the results from 179 respondents, scored under the Borda Count and Plurality voting systems. In addition, the aggregated results of all three polls are available here. Each cell indicates the number of times a coin in column 'i' was ranked above one in row 'j'. Values on the diagonal give the total number of polls in which each coin was ranked.
Rank
N = 87
Borda %
Plur %
N = 47
Borda %
Plur %
N = 45
Borda %
Plur %
1
XMR
78.16
35.63
DOT
68.47
10.64
ALGO
64.44
13.33
2
ETH
74.19
8.05
ALGO
67.89
8.51
MATIC
60.20
8.89
3
BTC
72.73
25.29
ATOM
65.57
6.38
BAT
57.58
15.56
4
LINK
67.19
10.34
KDA
64.60
14.89
XLM
56.57
6.67
5
DOT
49.74
2.30
HBAR
53.58
25.53
GRT
56.16
11.11
6
ALGO
45.14
3.45
XZT
53.00
6.38
UNI
52.53
6.67
7
BNB
38.98
0.00
AVAX
50.87
4.26
AVAX
51.52
6.67
8
PNK
38.24
0.00
SOL
43.13
0.00
ADA
49.49
11.11
9
LTC
35.74
1.15
ONE
41.78
4.26
IOTA
48.08
4.44
10
XRP
33.96
6.90
ADA
35.40
10.64
THETA
41.01
8.89
11
IOTA
33.33
2.30
FTM
30.17
8.51
BCH
35.76
4.44
12
ADA
32.60
4.60
ZIL
25.53
0.00
DOGE
26.67
2.22
While these data aren't sufficient to provide a comprehensive ranking of all cryptocurrencies considered, a few findings are obvious. First Monero (XMR) is the first choice among a significant proportion of /biz/ and has widespread support across the entire board. Given it has a market cap (as of June 18) of 4.878 billion, ~140 times less than that of Bitcoin, it is heavily undervalued according to /biz/. While Ethereum is only the first choice among a small propotion (8.05%) of /biz/, it also has more widespread support than Bitcoin. Finally, while a number of coins including Cardano, Ripple, and Dogecoin enjoy a high market cap, they are considered to be overvalued, with low rankings.
Lately I've been pretty busy, so haven't put aside much time to write. However, things have now settled down at work and with my hobbies, so it is worth giving an update.
Early last month Luke Smith posted a video lamenting the fact that recipe websites are incredibly bloated. Between the ads and the endless pages of life stories, it would be worth having a simple website that hosted recipes and nothing else. Fortunately, recipeasly.com provided just that. Unfortunately, their business model consisted of scraping recipes and images from other websites. Aside from the issues of rehosting copyrighted material, food bloggers stood to lose their ad-revenue, and so mobbed the creators. In response, recipeasly was taken down.
Rejecting all that free press (whether good or bad) seems a waste. So I immediately bought the recipeasly.org, .net, and .ca domains and set up a website of my own. So far, you can search recipes, browse by category, or via an image gallery. Each recipe also includes a printable index card. In the upcoming weeks I'll add a submission form, a rating system for each recipe, and possibly comments. Since I started, Luke Smith has also put up the site based.cooking. However, I don't care if my cooking is "based" and Luke is generally opposed to JS, so there is plenty of room for both our websites. As a way of marketing my site, and to ensure each recipe has a photo, I may hold a photo contest in the future with a cash or cryptocurrency prize.
Speaking of cryptocurrency, I've also spent a fair amount of time reading about the Basic Attention Token (BAT) since Brave released their new roadmap. This is in part because the price was steadily increasing. For example, the figures below demonstrate that the daily returns and volatility (averaged over each month) of BAT have steadily increased in recent months. Moreover, after a long period of underperforming relative to bitcoin, BAT has been outperforming since the start of 2021. As such, I managed to buy a fair amount at $0.68 before it shot up to $1.30.
Left: daily log-returns and risk (SD log-returns) from BAT, averaged over each month since April, 2019. Right: difference between BAT and Bitcoin log-returns.
However, I am more interested in the long-term use cases for BAT, and likely won't sell for the next few years. As of today, Brave now has 29 million active users and user growth has been incredibly steady. Since January 2019, users have increased by 124.92% per year, as indicated by log-linear regression. Moreover, this increase is extremely reliable, having an r-squared of 0.9877. In other words, 98.77% of the change in user numbers is accounted for as an exponential increase over time. If the current trend holds, Brave can expect to have 69 million users one year from now and 155 million in two years. However, with the upcoming release of self-serve ads, a decentralized exchange, and the ability to pay for goods and services in BAT, my estimate is likely conservative.
Total number of Brave monthly active users since release of the browser.
I've also been spending a good deal of time researching IOTA, as a fast, feeless, energy efficient network that scales limitlessly will be necessary for the future of cryptocurrency. Moreover, I'd like to set up a sensor network in my community, and IOTA seems like a promising platform for such projects. However, this is a topic for a future post.
There's a long standing belief that crypto dumps over the weekend, one reinforced by prices over the last few days. If systematic highs and lows do exist the market should adapt, causing the timing of the weekly dump to drift over time. Fortunately, it is easy to verify whether this belief holds true from historical price data. Hourly closing Bitcoin prices on Binance between August, 2017 and February 2020 are available from cryptodatadownload.com. Using this data, I calculated hourly prices in each week as the percentage of the weekly maximum. Afterwards, it is a simple matter to average all the weeks in a year, providing an indication of when Bitcoin is at its lowest.
Average hourly Bitcoin prices during the week, as a percentage of the weekly maximum.
As seen in the above figure, Bitcoin is generally at its lowest and highest during the weekend. Between 2017-2021, weekly lows moved from Sunday, to Friday, and back to Sunday. However, over the first months of 2021 the weekly dump has occurred Monday morning. Conversely, the best time to sell has drifted from Saturday to Sunday.
A: A 5th degree polynomial fit to Bitcoin prices. B: Detrended Bitcoin prices.
However, it could be argued that this data only demonstrates the average linear trend in Bitcoin prices over the week. In years where the price is steadily increasing, one should expect that the Saturday price will exceed that of the preceding Sunday. To correct for this bias, I detrended the price by fitting a 5th degree polynomial. As seen in the above figure, this was subtracted from the actual price, so that it now fluctuates around an average of $9900.
Detrended average hourly Bitcoin prices during the week, as a percentage of the weekly maximum.
The same hourly prices over the week were calculated using this detrended data. As seen above, prices have still tended to pump on Saturday since 2017. However, this is usually preceded by a dump on Friday morning. More recently, Bitcoin prices have tended to dump Monday, rather than on the weekend. Therefore, the belief that crypto dumps over the weekend does not hold true every year.
I stopped using Facebook a while ago. Aside from the issues with privacy and free expression, it was a time sink, and the news feed only served as a source of unnecessary anger. However, I have been using the Mastodon instance Fosstodon lately. It's largely devoid of international news, I enjoy the community, and has a code of rules that suit my preferences.
I'm interested in how Fosstodon operates, when its members are the most active, and how often they interact with one another. As such, I've been playing with the Mastodon API, in order to pull statuses and user information from the server. While I'm not much for Python, the Mastodon.py library is an easy tool for interacting with the API. It only requires registering an application and logging in to your server.
from mastodon import Mastodon

# create an application
Mastodon.create_app(
     'myapp',
     api_base_url = 'https://fosstodon.org',
     to_file = 'myapp_clientcred.secret'
)

# log in to our server
mastodon = Mastodon(
    client_id = 'myapp_clientcred.secret',
    api_base_url = 'https://fosstodon.org'
)
mastodon.log_in(
    'parker@pbanks.net',
    'aReallyGreatPassword',
    to_file = 'pytooter_usercred.secret'
)
After connecting to your instance, the mastodon.timeline() function pulls statuses from the home, local, or public timelines, or statuses with a given tag, starting from max_id. For me, each call returned the last 40 statuses, so I used the following loop to pull the last 50000 toots from the local timeline, from May 28, 2020 to February 7, 2021. Keep in mind there is a request limit of 300 per 5 minutes, so the time.sleep() funtion can be used to space out requests.
# request files from local timeline, starting at max_id
myFile=mastodon.timeline(timeline='local', max_id=105687600003001040, limit=40)
output=myFile

# use last status id at starting point for next request
myId=myFile[39]["id"]
for x in range(1249):
    myFile=mastodon.timeline(timeline='local', max_id=myId, limit=40)
    myId=myFile[39]["id"]
    output.extend(myFile)
The end result is a list of dictionaries that contain the time and content of each status, tags, number of replies, boosts, etc. Also nested within is a dictionary detailing the associated account, creation date, total followers, etc., that I pulled into a separate list. Given I am only insterested in the frequency and timing of toots, I also removed status tags, content, and other unnecessary information. Finally, I put each list into a pandas data frame and exported these to excel files.
# put account information into separate list
accounts = [output[0]['account']]
for d in output[1:]:
    accounts.extend([d['account']])

# remove unwanted fields
for d in output:
    for e in ['in_reply_to_account_id', 'spoiler_text','uri','favourited','reblogged',
	'muted','bookmarked','content','account','reblog','media_attachments',
	'mentions','emojis','card','poll','tags']:
        d.pop(e, None)
for d in accounts:
    for e in ['username','display_name','note','url','avatar','avatar_static',
        'header','header_static','last_status_at','emojis','fields']:
        d.pop(e, None)

#convert lists to data frames
import pandas
output = pandas.DataFrame(output)
accounts = pandas.DataFrame(accounts)

# delete time zone from status and account creation dates
dfPosts['created_at'] = dfPosts['created_at'].astype(str).str[:-6]
dfAccounts['created_at'] = dfAccounts['created_at'].astype(str).str[:-6]

# cast account id to string to prevent rounding errors
dfPosts['id'] = dfPosts['id'].astype(str)
dfPosts.to_excel("foss50k.xlsx")
dfAccounts.to_excel("account50k.xlsx")
CSV files containing the Fosstodon statuses from May 28, 2020 to February 7, 2021 and associated accounts are available here.
Lately I've been getting back into film photography. Some years ago I took a fair number of medium format pictures using a Holga pinhole camera. I never digitized any of my negatives, mostly due to the lack of a decent scanner. I still lack a proper scanner, having only a sub-par Brother model meant for documents. However, I may be able to use a few mathematical tricks to make it work far past its intended potential.
A poor-quality film scan.
As seen in my first scan, the main problem is I can't control the exposure time on my scanner and negatives end up much too dark. While some information can be recovered by correcting the contrast and gamma of each image, this is overwhelmed by the noise produced by the scanner. Moreover, I was lazy so the film was obscured by dust, hairs, and fingerprints. Fortunately, the random noise can be removed by averaging multiple scans. However, I also wanted to try removing various sources of systematic noise (i.e., prints, hairs, film imperfections). Ultimately, I took 125 scans of the negative in four different positions on the scanner bed, each with their own imperfections. After reading each image into Matlab, I corrected the contrast, gamma, and registered each image to align differences in position and rotation.
img = zeros(2692,5738,125);
for i = 1:125
    % read in scans and correct gamma and contrast limits
    img(:,:,i) = 1-mat2gray(double(imread(['Image_',num2str(i),'.bmp'])));
    img(:,:,i) = imadjust(img(:,:,i),[0.5, 1],[],10);
end

% register images, allowing for rotation and translation
mkdir Registered % directory for registered images
regImg = zeros(2692,5738,125);
[optimizer, metric] = imregconfig('monomodal'); % assume similar brightness and contrast
optimizer.MaximumIterations = 1000; % increase iterations
regImg(:,:,27)=img(:,:,27); % reference image

idx = [1:26, 28:125];
for i=1:length(idx)
    regImg(:,:,i) = imregister(img(:,:,i), img(:,:,27), 'rigid', optimizer, metric);
end

meanImg = mean(regImg,3);
figure; % display mean image
imshow(meanImg,[]);
Noisy, gamma and contrast corrected scans.
The end result is pretty rough. However, we can remove the noise produced by the scanner by taking the average of each pixel across all scans.
The average of all 125 negative scans.
However, two sources of noise still remain. The various hairs and fingerprints present in the different scans have to be removed. Second, regular vertical lines are present throughout the negative. While these would not be visible in a proper scan, the increased image contrast has made them more present. While the fingerprints will be difficult to address, the lines are regular and can be removed my moving the image into the frequency domain.
As seen above, a strong horizontal line is present throughout the frequency spectra of our image, representing the regular pattern of vertical lines. By removing these frequencies, we should also remove the lines without affecting the rest of our image. So, we will need a function to filter out frequencies ±2° from vertical. As the lines are closely spaced, we don't need to filter out low frequencies, only those above 200 cycles/image.
function thefilter = ofilter(oLow,oHigh,dim);
    % a bandpass filter of size dim that passes orientations between oLow and oHigh
    % horizontal and vertical are 0 and 90 degrees
    t1 = ((0:dim-1)-floor(dim/2))*(2/(dim));
    [t1,t2] = meshgrid(t1,t1);
    a=atan2(t1,t2)*180/pi;
    t1=t1.*t1+t2.*t2;
    clear t2
    a=mod(a,180);
    oLow=mod(oLow,180);
    oHigh=mod(oHigh,180);
    thefilter=ones(size(t1));
    if oHigh>=oLow
        d=find((a=oHigh) & t1>0); % find out-of-band frequencies
    else
        d=find((a=oHigh) & t1>0); % find out-of-band frequencies
    end
    if ~isempty(d)
        thefilter(d)=zeros(size(d));
    end
end

function thefilter = bpfilter(lowf,highf,dim);
    % a bandpass filter of size dim that passes frequencies between lowf and highf
    dc=[round(dim/2)+1,round(dim/2)+1];
    thefilter=zeros(dim,dim);
    dx=1:dim;dx=dx-dc(1);
    for yk=1:dim
        dy=dc(2)-yk;
        d=sqrt(dx.*dx + dy*dy);
        val1=find((d > lowf)&(d < highf));
        thefilter(yk,val1)=ones(1,length(val1));
    end
end

function thefilter=filter2d(lowf,highf,orient1,orient2,dim);
    % combines ofilter and bpfilter to pass frequencies between lowf and highf
    % and orientations between orient1 and orient2
    thefilter=bpfilter(lowf,highf,dim);
    temp=ofilter(orient1,orient2,dim);
    thefilter=thefilter.*temp;
    return;
end
Given the function filter2d, we can apply it to each image to remove all frequencies above 200 cycles/image that are within 2° of vertical.
thefilter = filter2d(200,5738,88,92,5738);
thefilter = 1-thefilter(1524:4215,:);

for i=1:125
    ft=fftshift(fft2(regImg(:,:,i)));
    amp=abs(ft);
    phase=angle(ft);
    r=size(amp,1);c=size(amp,2);
    dc=[round(r/2)+1,round(c/2)+1];
    dcAmp=amp(dc(1),dc(2));
    amp = amp.*thefilter;
    ft = amp.*exp(sqrt(-1)*phase);
    filtImg(:,:,i)=real(ifft2(fftshift(ft)));
end
Frequency filtered image.
Finally! We have removed the lines and are one step closer to having a clean picture. All that remains is to remove the various hairs and fingerprints present in each image. Fortunately, the position of these flaws varied between scans. I wiped down the negative, removing some prints and causing others to be deposited. Since presence or absence of these flaws are independent of the image, we can use independent component analysis (ICA) to isolate them and subtract them from our average image. The FastICA package is one of the best implementations of ICA.
filtImg=filtImg(59:2643,50:5678,:); % to avoid exceeding RAM capacity
[rows, columns, scans] = size(filtImg);
pcaArray = reshape(filtImg, rows * columns, scans)'; % reshape array for ICA
mu = mean(pcaArray,1); % the average image, ICA automatically subtracts this
[icasig, A] = fastica(pcaArray, 'lastEig', 8, 'numOfIC', 8); % take first 8 components
baseCase = mean(A(76:125,:),1); % scores for fingerprint-free images

% positive and negative parts of the first three components
ICAp1 = icasig(1,:); ICAp1(ICAp1 < 0) = 0;
ICAm1 = -icasig(1,:); ICAm1(ICAm1 < 0) = 0;
ICAp2 = icasig(2,:); ICAp2(ICAp2 < 0) = 0;
ICAm2 = -icasig(2,:); ICAm2(ICAm2 < 0) = 0;
ICAp3 = icasig(3,:); ICAp3(ICAp3 < 0) = 0;
ICAm3 = -icasig(3,:); ICAm3(ICAm3 < 0) = 0;
The first four independent components.
As seen above, ICA has isolated all the fingerprints and hairs that obscured our image within the first three independent components. Since all scans had defects, the absence of a flaw in one image implies the presence of another elsewhere. Therefore, each component captures both the presence (positive values & lighter pixels) and absence (negative values & darker pixels) of various features. As we want to make an image that contains none of these flaws, we separate the positve and negative values of each component.
All that remains is to find the ideal combination of component weights that removes all blemishes from the average image (mu). My approach was to generate random weights for two sets of components, add these to the average image, and indicate which looked better. It is a bit hacky, but a few iterations resulted in an image that looked half decent.
The final image, after filtering, ICA, and averaging.
And here it is, the final image. While it still could use a lot of work, the end result is a far cry from what my scanner initially produced. However, the main lesson is that I should probably buy a better scanner.
The importance of clean groundwater is pretty universal, about half of the world's population uses it for drinking water. However, ensuring that groundwater is clean and salt-free usually requires installation of a permanent monitoring well, a costly and often impractical process. Installing a well requires drilling equiptment, the wells aren't cheap, and they often get destroyed.
Conversely, measuring the salt content of a soil sample is a fairly simple process. It's temporary, doesn't require much equiptment, and you dont have to worry about landowners or animals destroying your handiwork. A while ago I published a paper on how to estimate the salt content in groundwater from soil samples. I've been learning JavaScript lately, so I made a tool for estimating groundwater quality from soil samples based on my findings. If you work in the environmental industry, hopefully you find it useful.
I finished writing the final edits to my Ph.D. dissertation today. Though I've decided against staying in academia and could have spent the last five years doing something more productive, I still consider it quite the accomplishment. At the very least I'll have considerably more time to devote to work, family, and adding to my website.
As such, it seems worthwhile to participate in the 100 Days to Offload popularized by Kev Quirk, the goal of which being to write one hundred articles within a year. I don't want to write simply for the sake of it, and I doubt I have enough original thoughts to fill one hundred articles. Regardless, it would be a good exercise to step away from scientific writing for a while and develop the habit writing regularly.
Lately, instead of adding content to my website or editiing audiobook recordings, I've been engaged in the anal-retentive task of minimizing my homepage's filesize. Web bloat has become a big problem nowadays, so this was a useful exercise in simplicity. I have done a few things I'm ashamed of, namely minifying my HTML and reducing my favicon to 16x16 pixels. However, this sacrifice has not been in vain. As of this post my homepage is 1.62KB and the top entry on 512kb.club, a meaningless achievement if there ever was one.
You may notice my blog system and website are derivative of Luke Smith and can be found on his GitHub. While I will alter his code to suit my tastes, I am in no rush to reinvent the wheel. Instead, I would like to focus building my website and making a few videos.
Lately I have been researching Urbit, a user-friendly personal server that has become popular as of late. In particular, I've been reading through the works of its founder, Curtis Yarvin (i.e., Mencius Moldbug), in order to understand his goal of using Urbit to create an alternative to the progressive philosophy that is so pervasive as of late. My first videos will probably be on these topics, the purpose of Urbit and its technical details. I'll also record a few audiobooks of Yarvin's major writings, as a way to get my speaking voice back in shape.
Apart from Urbit, I have a few other video ideas. I've been finishing my PhD thesis concerning the effects cannabis use has on the brain and decision-making, so I would like make some psychology and neuroscience oriented videos. I have a large backlog of experiments I need to publish, so videos might be a good way to distribute my research. Also, I've been using OpenBSD for a while now, partly for its philosophy (simplicity, security, package quality, etc.) and partly due to patriotism, as Theo de Raadt and I are both Albertan. There aren't too many OpenBSD videos on YouTube and I've been altering the LARBS ricing scripts to work with BSD.